File SystemWhat do we want in a file system?
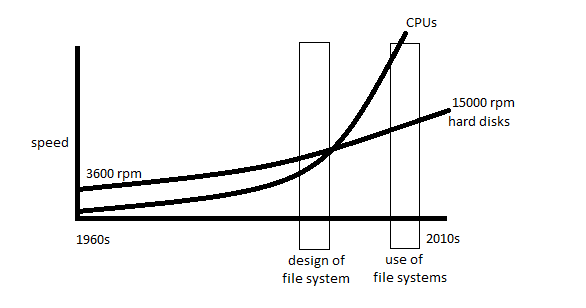
We can see that hard disk performance improves slowly over time. However, this is not entirely a fair comparison because we are now getting more data per revolution than we were back then. But it's still a physical limitation that affects the file system. Design of a file system: 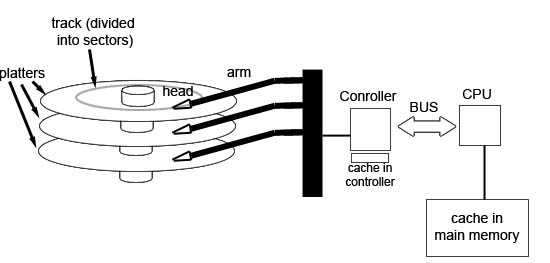 To read data from a random cylinder:
It takes the same amount of time to get the first 500 bytes of your file into RAM or to execute 10,000,000 insn. 10 ms is a long time. One solution is to go with flash.
There's a catch to using flash!
e.g. PREFETCHING (special case of SPECULATION): guess what will be read and read ahead of time.
It makes sense to get all the blocks in the neighborhood because it's likely that we'll keep fetching data sequentially. The above strategies are mostly aimed at reading. When writing, a different strategy should be considered. DALLYING: application tells file system what to do and file system waits a bit before doing it with the idea of saving work overall. If it waits, the "boss" might ask another question that could be done at the same time. It's like the BATCHING for write. Unlike SPECULATION, we wait to see if there is more work (that can be done together) instead of guessing what work needs to be done. Writing example: Application can say here are 512 bytes that I want to write out to disk. The file system says "okay I'll get to it" and it waits to see if the application has another write request. 512 bytes can be written to the buffer 16 times until you have 8192 bytes and then the buffer is finally written to disk.
LOCALITY OF REFERENCE: file access is not random in practice (it has patterns). SPATIAL LOCALITY (close in space): references tend to be clustered in space. Near in space/distance: our next access is often very close to recent accesses.  TEMPORAL LOCALITY: Locality changes over time Near in time: we will often access the same data again very soon.  example: times 1,2,3 might be in the same general area. Times 4,5,6 are in a different cluster. But later times (7,8) are back in the first cluster. We want a file system that takes advantage of these types of localities.
latency : delay between request & response throughput : how many request per second can my file system handle? It might be better to have a file system with better throughput than latency because it could get more requests per second done and overall it would get more work done. Or maybe you'll care more about latency and not so much of throughput. Latency and throughput can be competitive goals. utilization (of CPU) = % of CPU devoted to useful work. (As oppose to waiting) utilization (of disk) = % of disk devoted to useful data. Imaginary machine (simple #s) 1 ns cycle time (1 insn per cycle) 1 PIO (programmed input output) = 1000 cycles = 1 μs (1000 cycles because it needs to go through the bus and collaborate with various devices) 5 PIOs to send a command to "disk" (or SSD) = 5 μs 50 μs "disk" latency 125 cycles/byte = 0.125 μs/B for computation reads data (125 insn to figure out what to do with one byte) 1 PIO/byte to read data
Let's start out with the worst program we can think of: (simple but slow performance) simple slow program:
	for(;;) {
		char c;
		if(sys_read(&c) < 0)
			break;
		process(c);
	}
	/*This simple program has a simple loop that will read a single byte each time*/

	In order to read a byte, we had to send out 5 PIOs,
	wait 50 μs for the disk to wake and do something (latency),
	and read the data using inb (in byte instruction) (1 PIO).

	send cmd        latency       inb        compute
	    5μs     +     50μs    +   1μs    +   0.125μs    =   56.125μs/byte
	|________________________________|
	        latency = 56μs
latency: it takes 56μs from the time we wanted to read to the time we had the data.throughput = 1/56.125μs * 1,000,000 = 17,817 bytes/sec. utilization = 0.125/56.125 ~= 1/500 = 0.2% -This utilization isn't very good. Only 0.2% of the time it's doing useful work.
Instead of reading a single byte at a time, we can do batching to improve utilization.
	for(;;) {
		char buf[40];
		if(sys_read(buf,40) < 0)
			break;
		process(buf,40);
	}
	send cmd        latency       inb           compute      / buffer size
	(   5μs     +     50μs    +   40μs   +   (0.125 * 40)μs) / 40 bytes    =   2.5μs/byte
	|_________________________________|
	        latency = 95μs
latency: 95μsthroughput = 1/2.5μs * 1,000,000 = 400,000 bytes/sec. utilization = 5/100 = 5% -This utilization is a lot better than the unbatched 0.2%.
Still, it feels like we should be able to do better than 5% utilization. I. overlap input & computation
We'll use device interrupts:
pseudo:
	do {
		block until there's an interrupt;
		handle interrupt; //issues PIOs for next request and compute
	} while(more data);
While we are computing, we'll be doing IOs at the same time.
We will again read 40 bytes at a time and compute 40 bytes at a time, but this time we'll try do things in parallel.send cmd + latency||compute + inb) / buffer size ( 5μs + 50μs||5μs + 40μs) / 40 bytesThe compute time "vanished" because it's happening at the same time as we are waiting for the disk. However, this utilization is not that much better. Looking at the numbers, the throughput is not much less than what it was before because the compute time (5μs) is small compared to the IO time (50μs). How do we fix the problem? The buffer is too small. You want the time you last computing to be roughly the same as the amount of time doing IOs. If we have a balanced approach, then the computation and IOs will be done exactly in parallel. Here we could multiply the compute time by 10 to match the latency time (50μs). 400 bytes for the buffer should work! II. DMA (direct memory access) We have a smart disk control that can talk directly to memory. We issue the instructions to it and it will interrupt us when it's done. And we won't have to do expensive IO operations to fetch the data out of the disks one at a time because the disk controller will copy the data into RAM. You still need to do the PIOs to set up the operation (5μs). Assume we have a block size of 40 bytes. 50μs in latency (but done in parallel with computation). We don't have to worry about the PIOs per byte (there's no PIOs per byte). DMA: (5μs + 50μs + 0/byte PIO) / 40 (or 55μs/40)
Something was left out! An interrupt handler! When you get an interrupt in the low level, the hardware traps and you have to save (such as registers) into RAM. An extra overhead interrupt handler is going to take several instructions (say 5μs). If a file systems has a lot of IOs, the interrupt handler can become a bottleneck. III. DMA + polling The code is pretty much the same code we wrote on our simple program, but we don't tell the disk controller to interrupt. There's no interrupts! Instead we issue the commands to the disk controller, we do our computation, when the disk controller is done we start polling "are you ready?" If we balance our IOs and computation time, when we ask "are you ready?", it'll be ready. So, we avoid the overhead of interrupt handlers, which increases throughput. If we "played our cards right", our utilization will be about 50μs/55μs. We normally don't want a busy wait because it wastes the CPU, but if we timed IOs and computation correctly we should be OK. On I, II, III we made the assumption that we only have one CPU and one application, which are useful for embedded applications. But in practice, you'll almost always have multiple applications. IV. Multitasking while(inb(0x1f7) & 0xc0 != 0x40) //while disk isn't ready /*instead of looping with continue, use yield*/ yield(); //let somebody else runHere we are trying to take the CPU and assign it to a thread that can make better use of it. We want the CPU to do useful work as much as possible to try to get the utilization to 1. The idea of multitasking (giving up the CPU to useful threads) is so powerful, that for many applications, we don't have to use I, II, and III. The read() system call in implemented like this.
|