CS 111 Lecture 16 Scribe Notes - Spring 2012
Continuing
from the discussion from the previous class about the consequences of
power failure, this class started with a discussion about disk failure.
One
possible way to address this issue is to use logging. Whenever there is
any change to the file system, this change is logged in a journal. When
the system crashes, while recovering data, the system can check the
journal and see which operations were being performed at the time of
the crash and take appropriate measures to ensure that there is no
corruption or incomplete operation. However, this issue would not work
in case of a disk failure, as the journal itself is present on the
disk.
RAID
- Redundant Array of Independent Disks (previously: Redundant Array of Inexpensive Disks)
- The
original goal behind the concept was to save money (e.g. it is much
cheaper to buy 5 1TB disks in comparison with 1 5TB disk)
- However, over time the main goal has changed to gaining reliability
RAID 0 - Concatenation
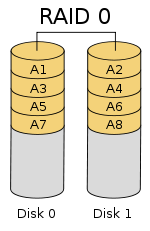
- The only goal here is to save money. For e.g., it is usually cheaper to buy 5 1TB drives in comparison to 1 5TB drive.
- There is no redundance, just a simulated big disk
- Data can be arranged in one of the two methods:
- Sequential Read
- Here the data is stored sequentially
- Performance of a virtual disk is about the same as that of a physical disk + small overheads
- On failure, easier to recover
- Easy to add new disks (while upgrading the system)
- Striping
- Contiguous data is split into several physical drives. Hence data can be read in parallel from independent drives
- Performance can be as good as n times better (where n is the number of disks)
- It is however not easy to grow the disk, as the addition of a new disk can cause the striping to be rearranged
RAID 1 - Mirroring
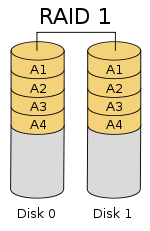
- The basic idea of RAID1 is mirroring the disk so that the system would not fail even if one of the disks fail.
- Every write operation necessiates a write operation on both the disks
- The read operation can be performed on either of the disks. Hence read is possible in parallel.
- Since
the reads can be performed from either of the disks, the performance
can be optimized by performing the read from the disk arm which is
closer to the actual data, thus decreasing seek time and improving read
time.
RAID 4 - Parity
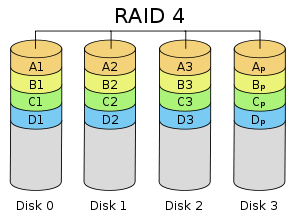
- In RAID4, one of the physical disks is used as a parity disk
- The
parity disk stores the XOR of all the other disks. This way if any disk
fails, we can recover the data by simpling computing the XOR of the
other disks.
- Consider there are 5 disks, A, B,C, D and P,
where P is the parity disk while the rest are normal disks. The parity
disk, P is calculated as A^B^C^D. If C fails, we can regenerate it as C
= A^B^D^P
- Reads a re similar to RAID0
- Writes are similar to RAID1, since data has to be written to two disks for each write.
- Drawbacks:
- If
one of the disk fails, care must be taken to make sure that the disk is
replaced immediatiely. Else there is a risk of losing all the data in
the system.
- Since the parity disk, has be updated everytime anything is changed, that disk becomes a hotspot for activity.
RAID 5 - Parity with striping
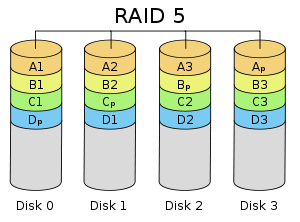
- This is similar to RAID 4, except that the parity bit is
also distributed across the disks. This deals with the problem
mentioned in RAID4 where the parity disk has a higher chance of failure
due to the high activity occurring there.
Typical Disk Failure Characteristics
Based on the probability of disk failure provided by Disk drive
companies, the Mean Time To Failure (MTTF) of a typical disk is around
300,000 hours or 34 years. However in reality, this is about 5 years.
After 5 years, it is cheaper to buy a new disk rather than use the old
disk because of the power gains provided by the new disk.
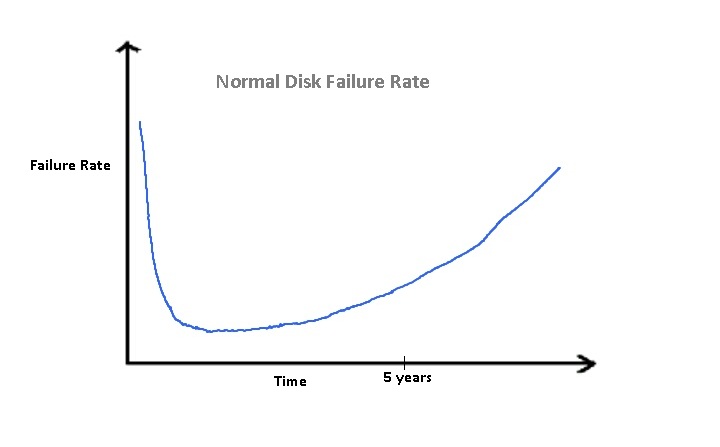
The above figure shows the Probability Density Function (PDF) of a
normal disk failing. Interestingly, there is a high probability of
failing in the initial period due to manufacturing error. This is
followed by a relatively long stable period. As time progresses, this
curve starts getting steeper.
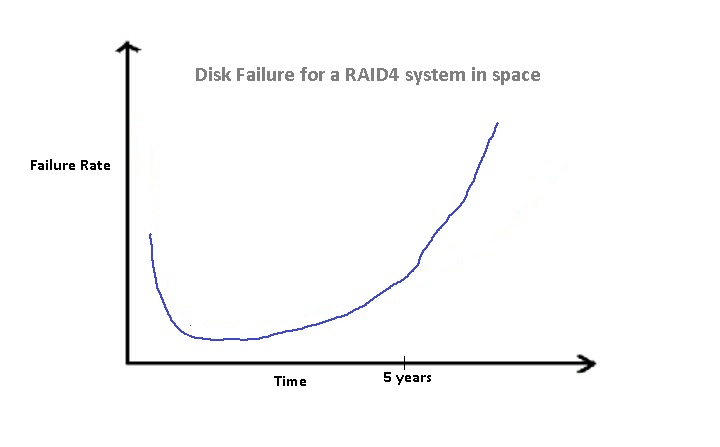
The above figure shows the Probability Density Function for a RAID 4
system installed in space failing. Basically, it is a RAID 4 system
where the disks cannot be replaced even on failure. Similar to the
previous figure, there is a high probability of failing in the initial
period. However, this is lower than the probability for a single disk
due to the redundancy introduced by the parity disk. The probability of
failure as time progresses increases up to 4x times the rate of failure
for a simple disk.
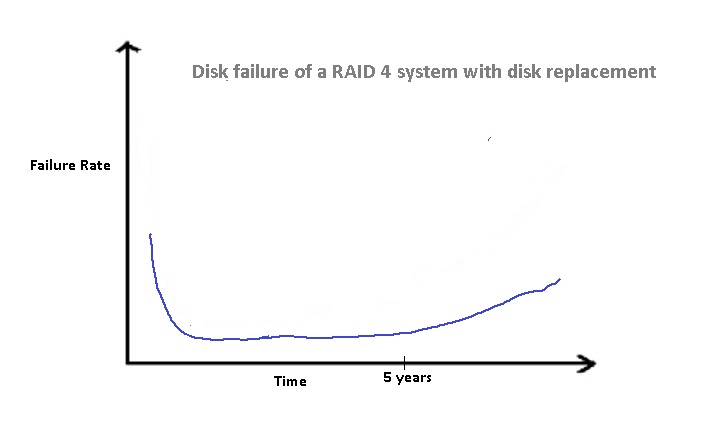
The above figure shows the Probability Density Function of failure
for a RAID 4 system installed in in a typical server room. In this
scenario, it is expected that a operator would replace the disk as soon
as it fails. Thus, after the five year period, the failure rate doesn't
go up as steeply as it does in the case where we don't replace disks.
RAID would however not make disk backups seem redundant since RAID
does not protect against user errors which could corrupt the disk.
Distributed Systems and RPC
Remote Procedure Call (RPC)
- Wikipedia - "In computer science, a remote procedure call (RPC)
is an inter-process communication that allows a computer program to
cause a subroutine or procedure to execute in another address space
(commonly on another computer on a shared network) without the
programmer explicitly coding the details for this remote interaction.
That is, the programmer writes essentially the same code whether the
subroutine is local to the executing program, or remote. When the
software in question uses object-oriented principles, RPC is called
remote invocation or remote method invocation."
- Caller makes call like
- Actual Implementation
- send(buf, n) to server and wait for response
- Callee and Caller do not share address space.
- Thus, we do not get the efficieny gains of Call by Reference
- Advantage
- Caller and Callee may be on different architectures (eg. ARM
and SPARC)
- Drawbacks
- Some machines may be little endian while others may be big
endian.
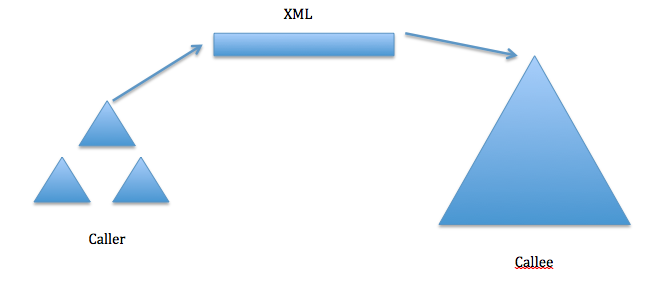
- This problem is solved by marshaling.
- Marshaling and Unmarshaling is often automated.
- Generate stubs or wrappers to do marshaling -> Protocol Description + API Description
- In the above example, we are using one of the common forms, XML, to send data to the Callee
- Failure modes are different
- Callee cannot trash caller's memory and vice versa (Hard Modularity)
- System calls do not give the same hard modularity as RPC
- Since on Network :
- message can get lost
- message can get corrupted
- duplicate messages
- network can go down or could be super slow
- server can go down and/or be super slow
- What should a stub/wrapper do:
- If corruption then resend
- If no response then
- Keep trying. This could be suitable for idempotent
operations (At least once RPC).
- Give up and return an error. More appropriate for
transactional operations (At most once
RPC).
- However, the user wants Exactly
once RPC
- RPC
Examples
- Example 1
- Client sends : "GET /foo/bar.html HTTP \r\n"
- Server responds : "HTTP/1.1 200 OK \r\n ________(some more
stuff)"
- There is a protocol called SOAP which is built upon this. It
specfies the *some more stuff* field above.
- Example 2
- Say a client want to draw a pixel, it
can send the following
requests to the server:

- Server responds with "OK"
- This works even if they are on the same machine.
- You could also have functions that work on higher level primitives like, say, fill_rectangle()
- Perfomance Issues with RPCs
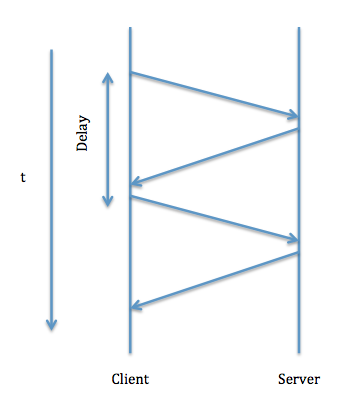
You could have very long delays as we can see in the diagram
-
- Ways to resolve performance issues of RPCs
- Higher Level Primitives - We can fix that if we use a higher level primitive. For this we would need to come up with an API in which operations are of the right size.
- Asynchronous RPC - We can issue a bunch of RPCs back to back and then wait for responses to all of them. The responses could be in any order, since there is no guarantee of ordering due to unpredictable network behavior, different time to process at server.
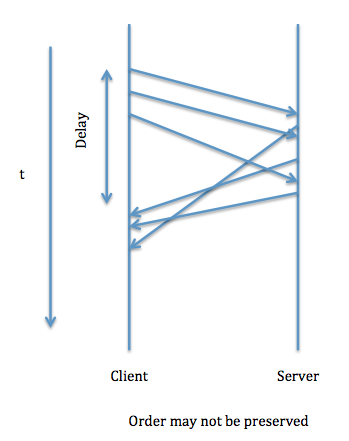
- Advantage: Better Performance
- Drawback: Can complicate caller, since order may not be preserved.
- Example
- OLD : draw_pixel(x, y, color);
- NEW : request = draw_pixel(x, y, color);
wait_for(request);
- In this case, the client has to know about the notion of outstanding requests. Thus, the abstraction offered by RPCs is somewhat weakened, since the client is now aware of an RPC call being made.
- Cache in Caller - For simple stuff, not for long complicated procedures.
NFS Protocol
- NFS is a file system built atop HTTP.
- NFS can be approximated to a UNIX file system on wheels.
- Example Operations (fh - file handle. Unique handle for a file within a file system)
- Lookup(dirfh(int),name(string)) : Response -> fh + attr (size, owner, . . . etc)
- CREATE(dirfh,name, attr) : Response -> fh + attr
- REMOVE(dirfh, name) : Response -> status
- READ(fh,size, offset) : Response -> data
- WRITE(fh,size, offset, data) : Response -> status
- Want NFS to be reliable even if the file server reboots.
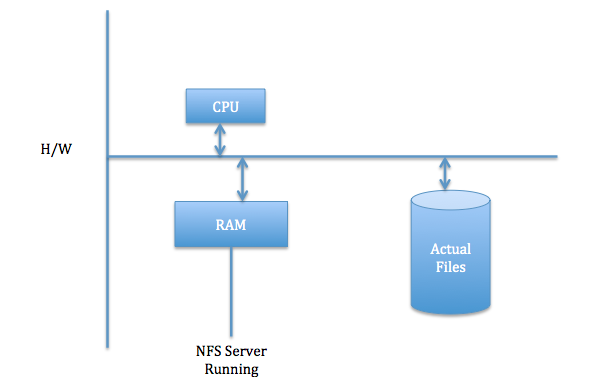
- Hence, we choose to implement it as a stateless server.
- When a client does a write, it has to wait for a response before continuing.
- We could reissue requests if the server crashes.
- However, NFS server cannot respond until the data hits the disks.
- NFS would be slow for writes.
- To fix this problem, we cheat
- Use flash on server to store pending writes.
- Writes don't really wait for server responses. If a write fails a later close will fail.
- Using fsync and fdatasync would be slow.
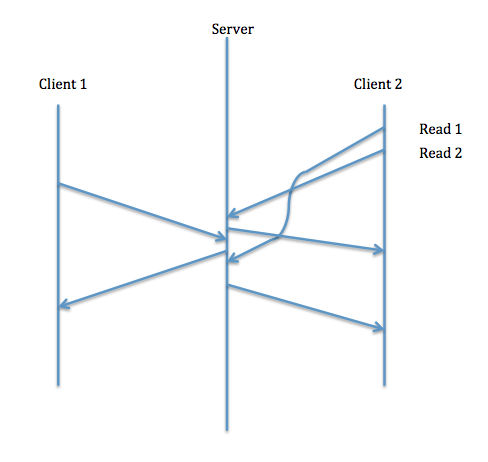
- In general, clients will not see a consistent state. NFS by
design doesn't have read/write consistency for performance reasons.
Though, it does have consistency for open/close, sync, fdatasync.
References
